
Introduction to SLC-500 Trending
There are several reasons you would set up SLC-500 Trending. With Trending, you will generally track analog signals over time. Although you can also track discrete (on/of) signals, a Histogram is usually better suited for that. Although you can track any signal, I’m just going to use the simple accumulated value of a timer to show how to configure a trend chart. Remember that you must be online to actively trend data.
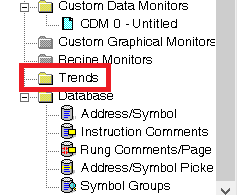
To see if you have trending available in your software, look at the bottom of the project tree. You will find a folder called “Trends” if this feature is available.
Examples of where you use a trend might be to track a bearing temperature over time. You could also use it to tune PID loops, or monitor the speed of a motor over time. Realize this is not a historical trend. The Trend chart will only track from the time that you started the trend chart. If you need historical data, you should use other software such as FactoryTalk View.
Starting a new Trend Chart
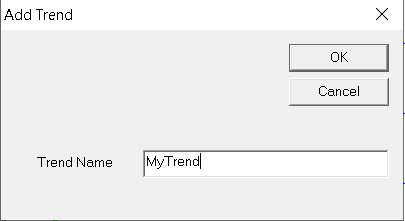
To start a new trend chart, right click the trends folder, and create a new trend. We’ll give the trend chart a name, then press OK.
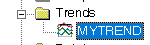
Next, double click “My Trend” to open your chart.
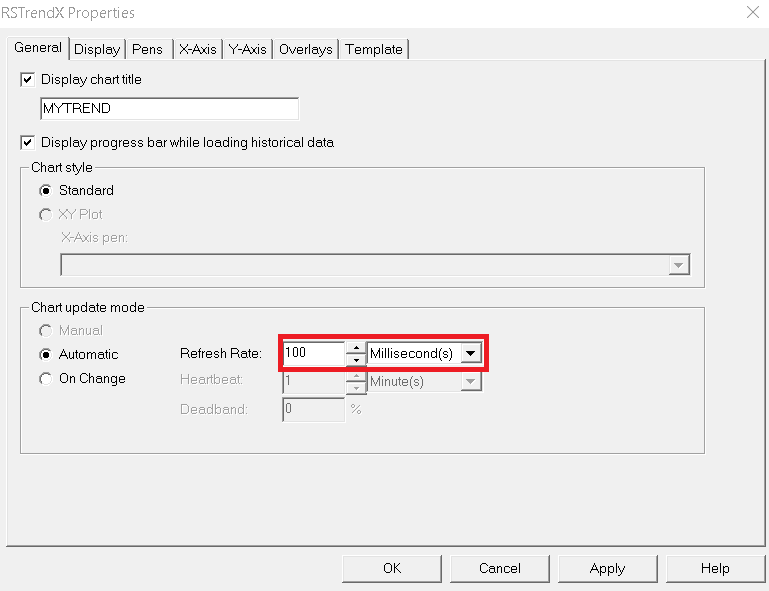
You can perform all of the configuration under chart properties. Right-Click the chart, then choose “Chart Properties”.
We will configure a few settings. On the “General” tab, I’m going to set the Refresh Rate to 100ms to make the chart run a little more smoothly. Basically, this just sets the update rate for the tag. Realize the faster the update rate, the more bandwidth y ou will use in the network.
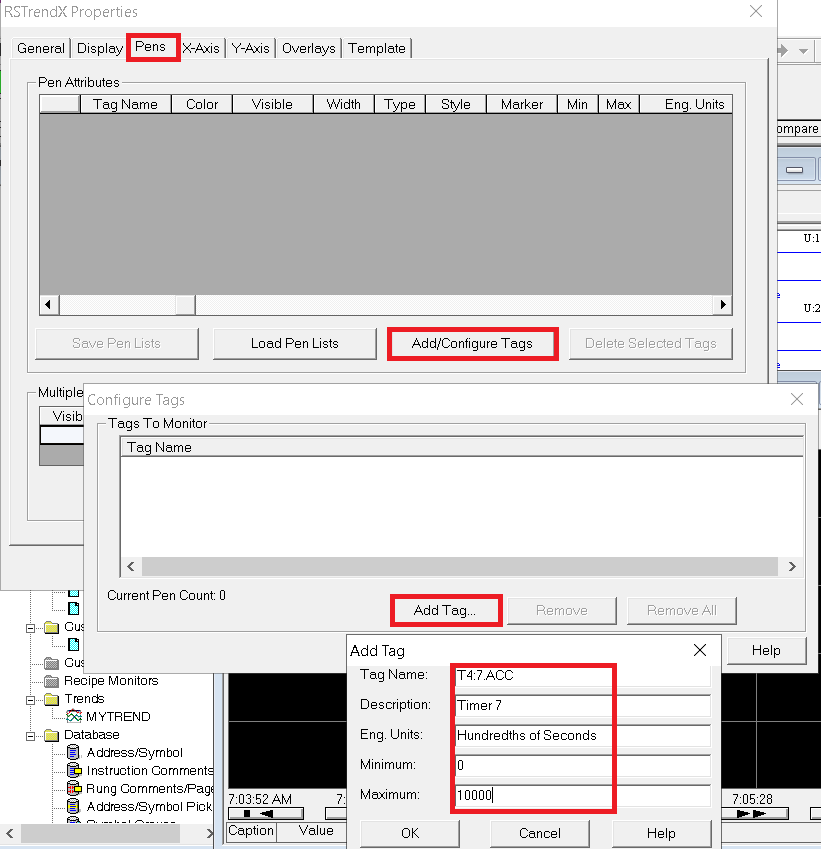
Secondly, I’ll go to the “Pens” tab, and choose Add/Configure Tags. I’m going to then choose “Add Tag”, and set up the tag fields as shown. Press OK, then OK again.
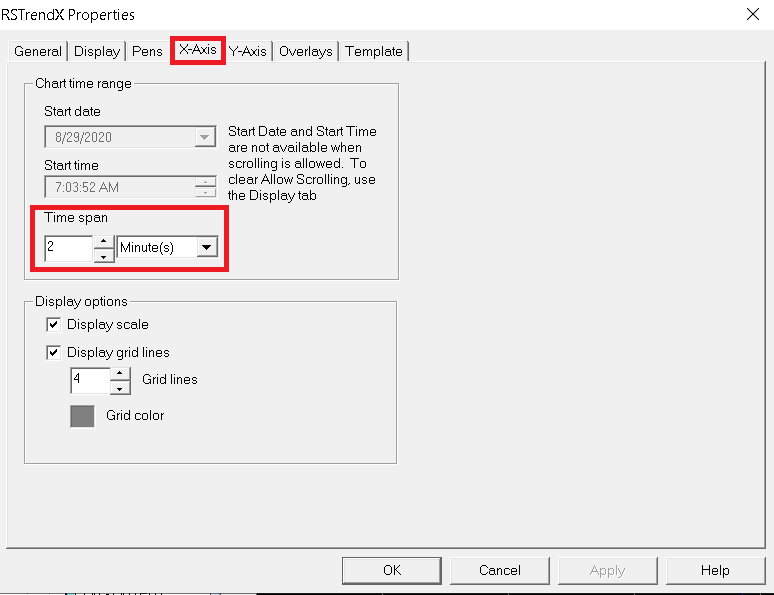
Next we’ll go to the “X Axis” and set up the time span. This is the amount of time across the chart, left to right.
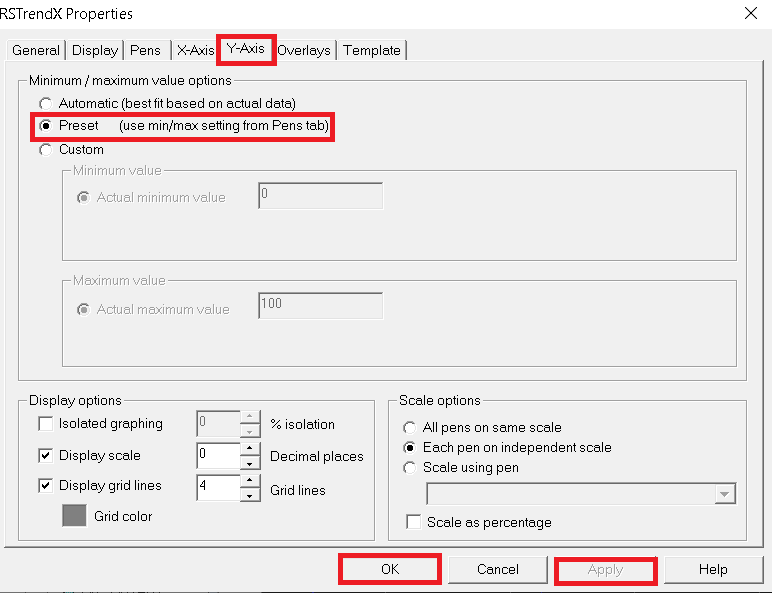
At last, I’ll set up the Y Axis tab. This will be for our scale (up and down on the left edge of the chart). We’ll chose “Preset”, because we entered the values for the min and max already on the pens tab. If you have multiple pens, choosing the preset option allows you to have a different scale for each pen.
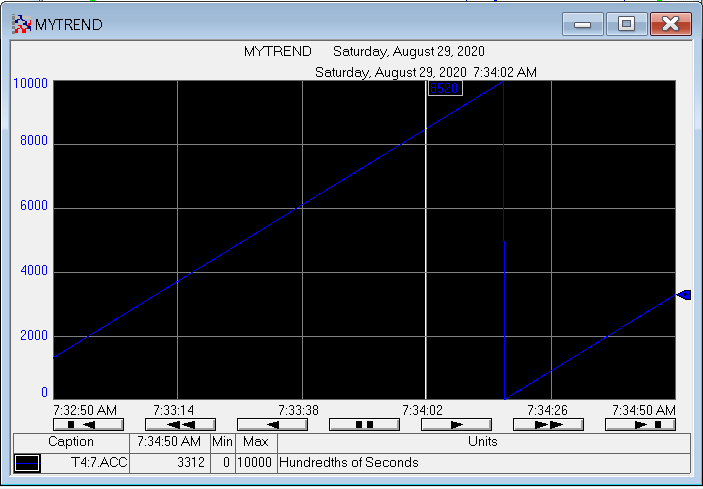
The chart is now running. Click anywhere on the chart, and you will see a value bar. This tells you the value of the tag at that moment in time.
Final Settings
To summarize, you can go back to “Chart Properties” and tune the chart exactly as you like. You can also add multiple pens (up to 8, I believe). Chang the color of pens, and even the background color. Explore other options to find other capabilities of the trend chart you might be able to use.
It’s important to realize that if you click and drag your mouse, you will put the chart into zoom mode. This happens a lot accidentally. To get out of Zoom mode, right click the chart, and undo zoom/pan. You might also have to un-pause the chart.
For other information, visit the SLC-500 category page.
— Ricky Bryce