
Introduction to ControlLogix Trending
ControlLogix Trending will track values over time. Most commonly, you will use trending on analog values, but it can be used to track digital (discrete on/off) signals as well. Think of trending as a “software chart recorder”.
In this example, we will use trending to track a Pipe Pressure over time. The pipe pressure will run from 0 to 200 psi over a period of 20 seconds. If the pipe is not holding pressure, we would see that on the trend chart. This could indicate a failure in a seal. If you have not done so, refer to my post “ControlLogix Analog” to learn how to set up and scale your analog module.
Create your Trend
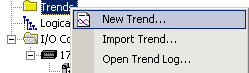
To create a Trend, right-click the trends folder in the Controller Organizer window, and select “New Trend”.
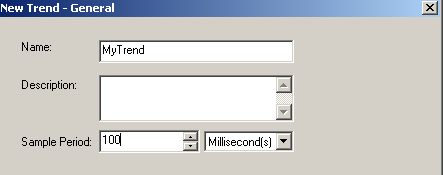
Next, name your trend and choose the sample period. The sample period is how often the pen will update it’s data on your chart. Here, we will choose 100 ms. Click “Next”.
Select the tags you wish to trend. Then you will click the “Add” button, and your tag will appear under the box for “Tags to Trend”. After you have added your tags, click “Finish”. Your Trend is now created.
Adjust the Scale
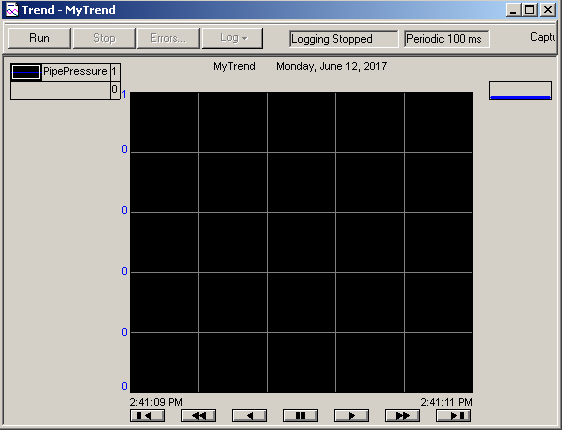
First of all, look at the time across the bottom of your chart. You will see we are only looking at a 2 second time period. The amount of time across the bottom is called the “X Axis”. Another adjustment to make is the scale on the left edge of your chart. By default, this is set to Automatic mode. This means the scale will change based on actual data. At times, this can cause confusion though. We will lock in the values of 0 to 200 psi. This scale is referred to as the “Y Axis”.
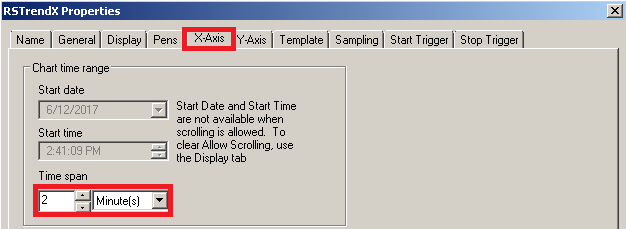
To configure the scaling, right-click anywhere on the chart, and go to “Chart Properties”. I will click on the “X Axis” Tab, and change the time span to 2 minutes.
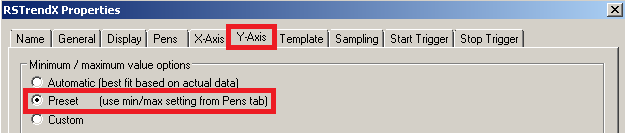
Also, we will go to the “Y Axis” Tab, and you will find 3 options. In Automatic mode, the scale is adjusted to fit based on actual data. In Preset mode, we will put a minimum an maximum value into the “Pens” tab for each pen. The other option is to lock in a custom value. Since we anticipate tracking more than one value some day with different scales, we will choose “Preset”.
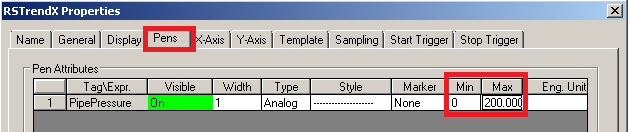
Furthermore, since we chose “Preset”, we will need to go to the “Pens” tab, and add a minimum and maximum value for the “PipePressure” pen. While you are here, you can also adjust the color of the pen, and the width to make your pen more visible.
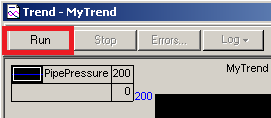
At last our trend chart is all set up. Press “Apply” and “OK”. Next, we need to click the “Run” button on your trend chart.
Run your Trend
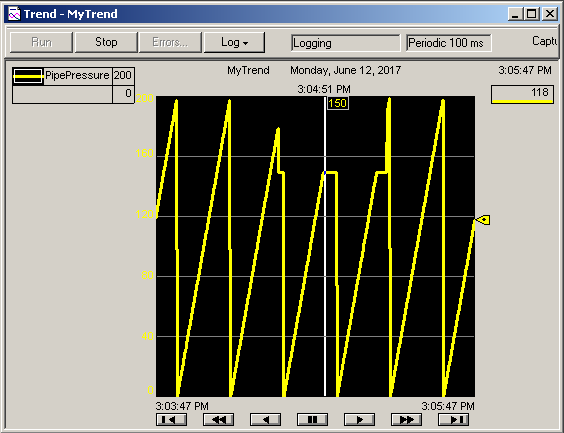
Finally, you will see your pen track the PipePressure tag over time.
Click anywhere on the chart, and a value bar will appear. This value bar tells you the value of the pen at that moment in time. In this instance, we can see that we have an occasional pressure failure of around 150 psi.
Be aware that if you click and drag your mouse across the screen, you will draw a box on the chart. When you release your mouse button, the chart will be zoomed in. To get out of zoom mode, right-click the chart, and choose “Undo Zoom”. You may also need to “unpause” your chart. The Pause/scroll button is at the bottom of your trend chart.
For more information, please visit the ControlLogix Post page!
— Ricky Bryce
Is it possible to ad more than one value bar?
As far as I know, this trend chart allows for just one value bar. The help file refers to it as singular, so I would assume there is just one available at any given time. You can move the position of the value bar through sample points by pressing “CTRL”, and then use the right or left arrow keys (or just simply click another location on the trend chart). Additionally, you can stop the chart, and under “Log”, “Save Trend Log As”, to export the trend in CVS format to view all of the data points at once on a spread sheet.
Right click on the pen area then add any other tags you want to trend.
Is there a way to use a trigger tag to create a snapshot of your trend values when the trigger bit comes on? I remember being able to do this in RsLogix 500.
Thanks, Tom. You can create a start and stop trigger for the chart like you could in RSLogix 500, or RSLogix 5, but I do not know of a way for the trend chart to capture values based on a trigger in RSLogix/Studio 5000. One option you would have is to create an array in the processor, such as “DataCapture”, with a datatype of DINT[7] (or REAL[7]). then you could create logic to move data into different parts of the array when the bit goes high. I would use an ONS between your trigger bit and the MOV statements. With this method, the trigger would log your values to the array even if the trend chart is not running. If you create a new subroutine for this logic, don’t forget to add a JSR from the main routine.