
Introduction to FactoryTalk View SE Trends and Data Log
With FactoryTalk View SE Trends and Data Log, we will log background data, and plot that data onto a trend chart. Without the data log, the trend chart will only show live data at the time the trend was started.
Basically, we’ll walk through how to create a data log. We’ll run the data log in a startup macro, and associate the data log to a trend chart. Altogether, we’ll have a trend chart where the operator can view data from any point in time.
Create the Data Log
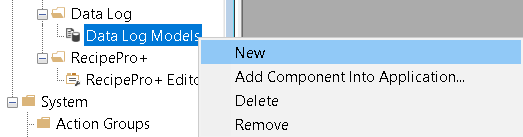
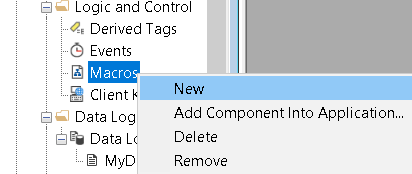
At first, we’ll right click the data log models, and add a new data log.
In the general tab, we will obviously put in a description of our chart. For example, we’ll just log to a file set. Conversely, you could log to an SQL Server using an ODBC connection.
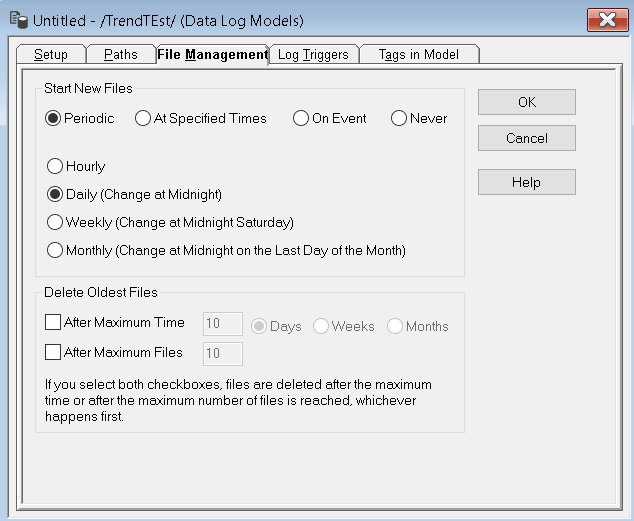
At this time, let’s leave the paths at their default location. Go to the “File Management” tab. In this case, we will leave the settings at default, but you could choose when you would like to start a new log file on your storage device.
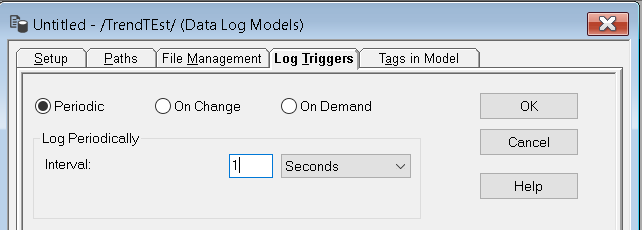
Go to Log Triggers, and define how often you need to sample the tag. We’ll set this at 1 second. Remember this is just the sample rate. This is not the amount of time from left to right across the trend chart.
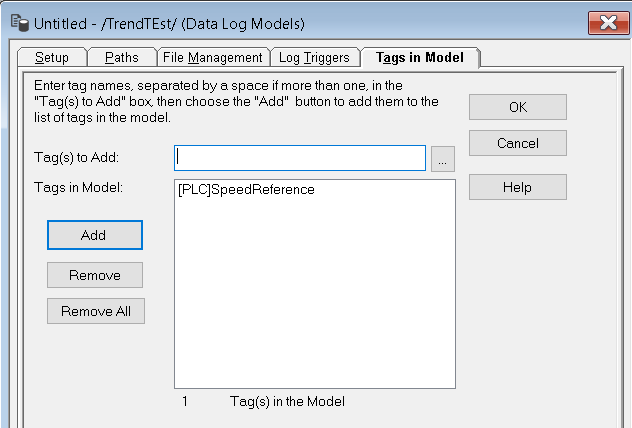
It’s most important to go to “Tags In Model”, and add the tags you wish to log. Be sure to hit the “Add” button after selecting your tag, so the tags appear under “Tags in Model”.
Press OK, and save the changes. In this example, I’ll name it “MyDataLog”.
Create a Startup Macro
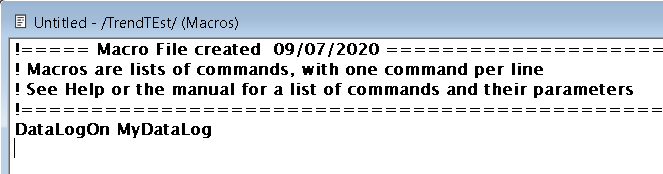
We need the data log model to run at startup. A startup macro allows us to do this, and many other commands we might wish to run at startup. If you are modifying an existing project, just add the command “DataLogOn MyDataLog”. Where MyDataLog is the name of the data log you just created. In this case, though, we’ll create a new startup macro. Right-Click Macros, and add a new macro.
Add the command as shown below. Close your macro, and save it as “Startup”.
Create the FactoryTalk View SE Trends
At last, we’ll add the trend chart. On a new display, go to Objects | Trending | Trend. Add the object as large as possible onto this display. Be sure you have navigation buttons to get to and from this display.
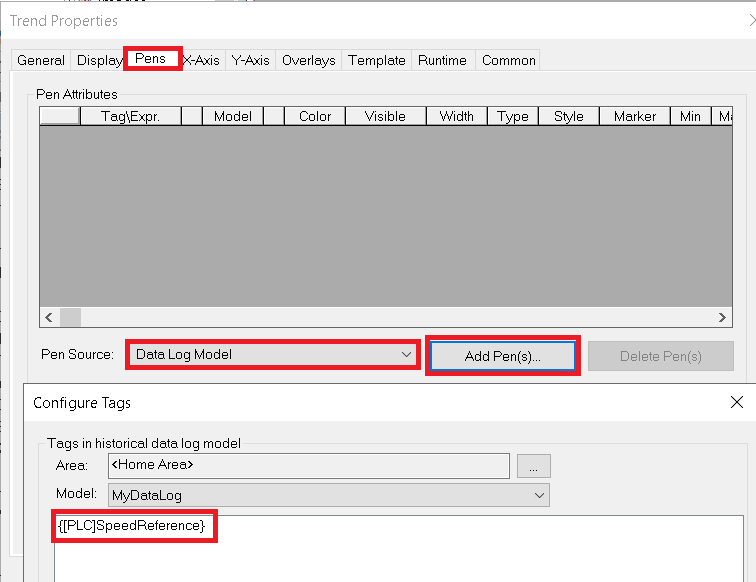
In the properties of the Trend chart, go to Pens. Select Data Log Model as the pen source. Add Pens. Choose the tags you wish to monitor, then press OK.
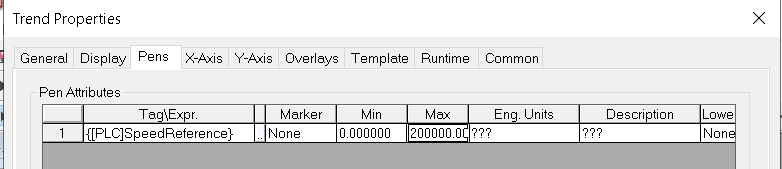
Next, be sure to set the Min and Max values of the tag. You can also adjust the color and width of the pen.
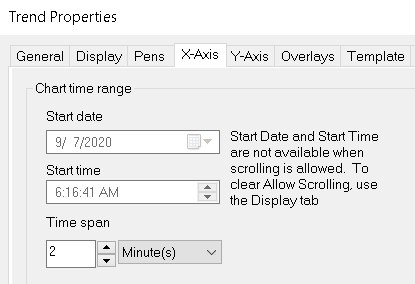
Go to the X-Axis, and set your time span.
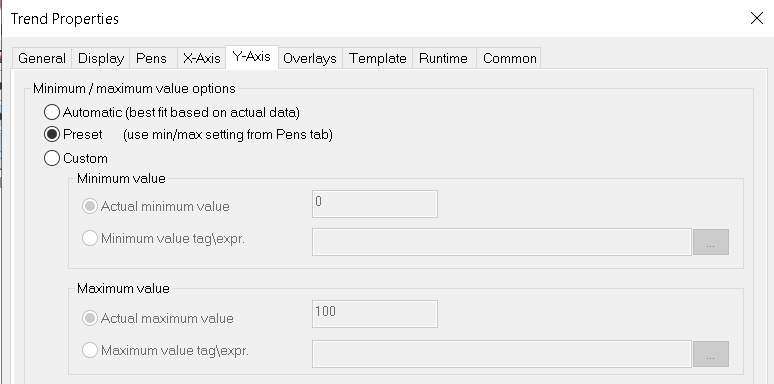
Finally, on the Y-Axis, we’ll choose “Preset”. This will use the min and max settings from the pens tab.
Close your display. In this case, I’ll save it as “Trends”, and just make that the startup screen. Again, if the trends display is not your startup screen, be sure you have navigation buttons to get to and from this display screen.
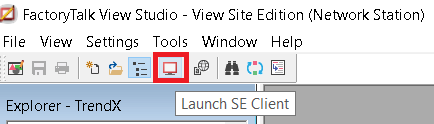
Launch the Client
Even though we have a button to test the single display in FactoryTalk View, that will not work for this example. We need to run the full application, because we are testing the datalog as well. In order for the startup macro to run, we need to create a client file.
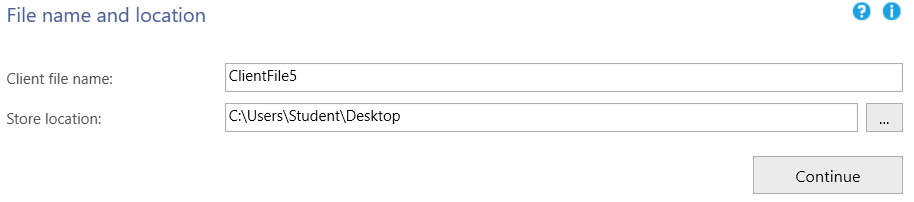
Click the “+” to create a FactoryTalk View SE Client configuration file.
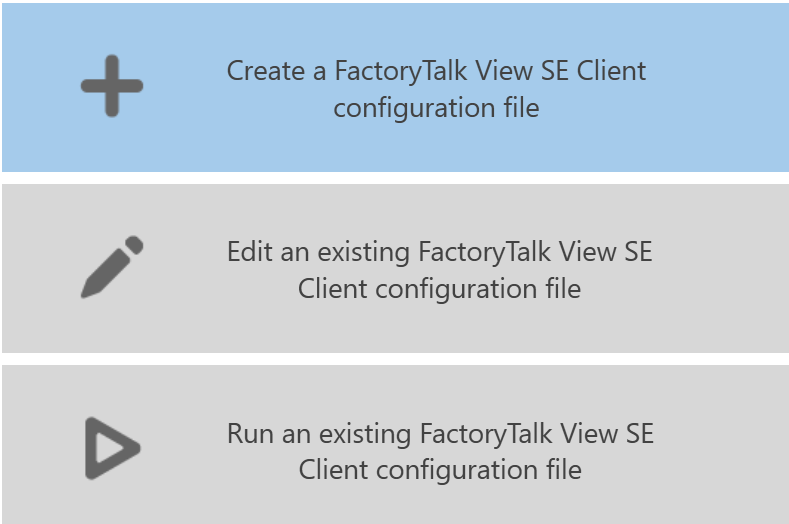
We’ll just continue with the default settings.
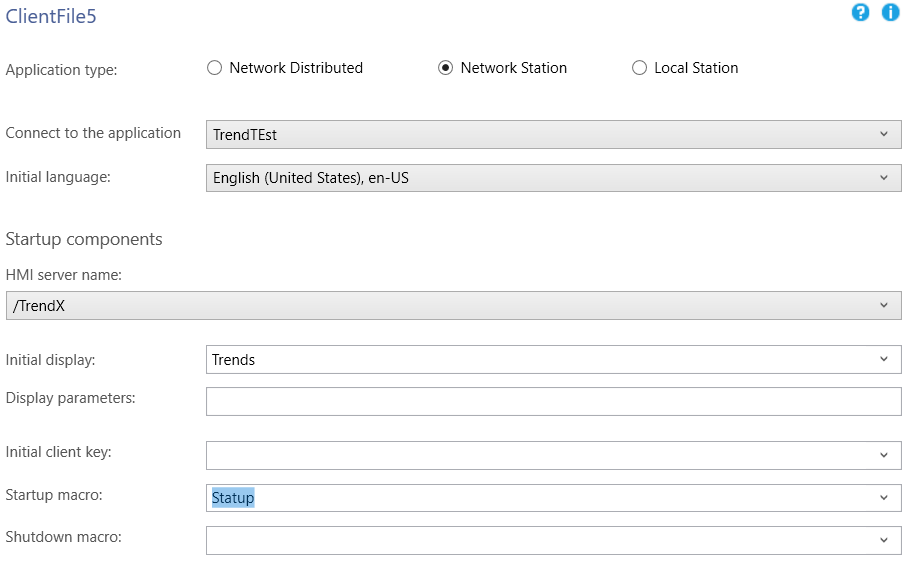
Be sure to choose the application type, the application name, initial display, and startup macro. Then click “Save” and “Run”.
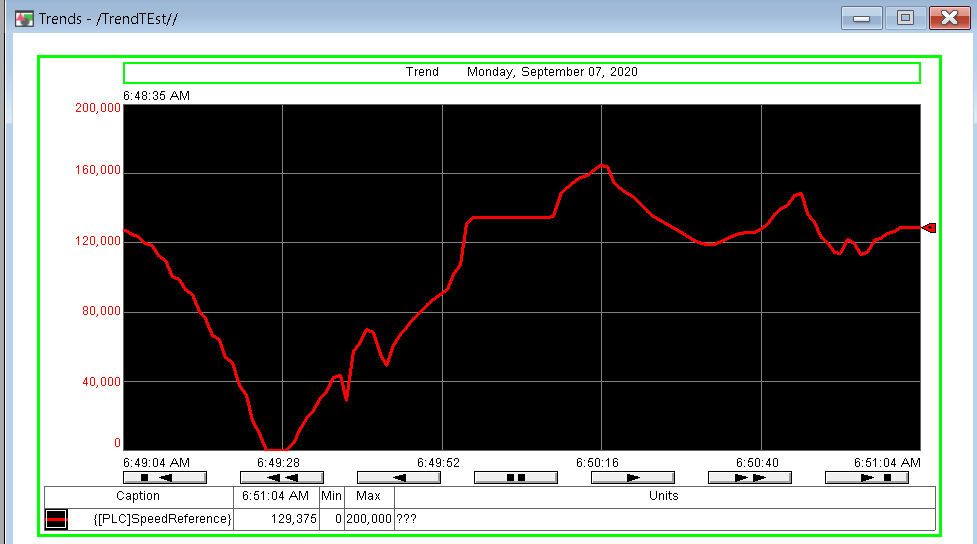
Your trend chart should now be all set up and running!
For more information, visit the FactoryTalk View SE Category Page!
— Ricky Bryce
Very good explanation given by B A automation
Thank you, Ramu… Feel free to visit the site any time.
— Ricky