
Introduction to the FactoryTalk View Bar Graph Object
The FactoryTalk View Bar Graph object provides you with a graphic indication of analog signals. In addition, we will set thresholds to change the color of the bar graph. By the same token, you could use a Gauge object. The object you use simply depends on the preferred appearance of the display. In this example, we will measure the temperature of a bearing. In this case, we prefer the bearing temperature to be between 100 and 180 degrees Fahrenheit. If the temperature is below 100 degrees, the gar graph will be yellow. Obviously, if the bar graph goes above 180, we want the color to be red. Similarly, a temperature between 100 and 180 will be green.
Add the FactoryTalk View Bar Graph Object
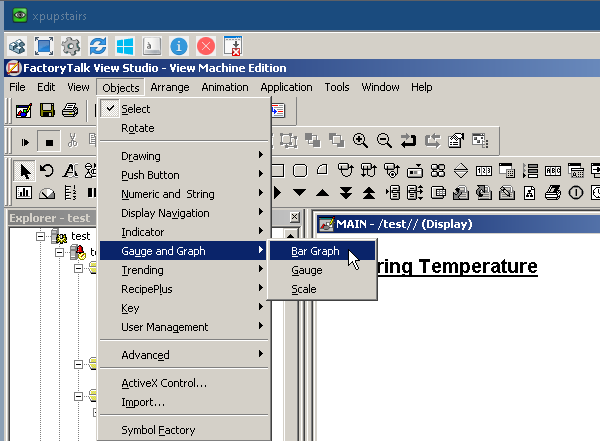
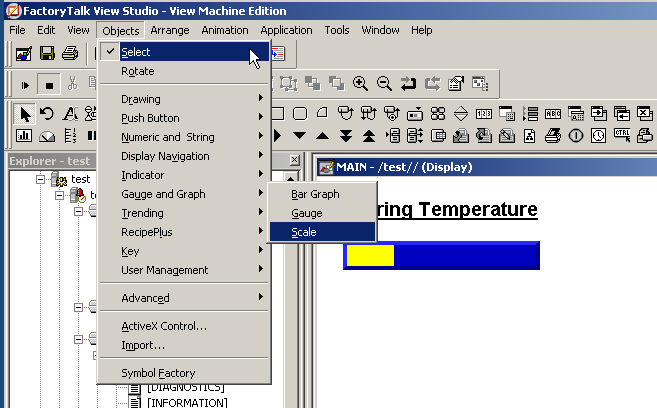
With your display open (and focus on the display), go to Objects | Gauge and Graph, and choose “Bar Graph”.
At this point, draw the bar graph on your display. Draw the bar graph vertically or horizontally. For example, I will use a horizontal bar graph.
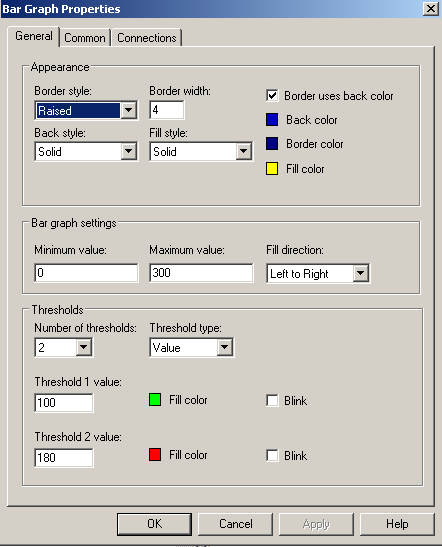
Because the graph needs to be yellow before meeting any thresholds, we’ll start with a yellow fill color. Since 150 is the nominal operating temperature, we’ll configure the range from 0 to 300. In this case, I drew the bar graph horizontally, so we’ll fill from left to right. At 100 degrees, we need the fill color to turn green. Likewise, at 180, we want the fill color to turn red.
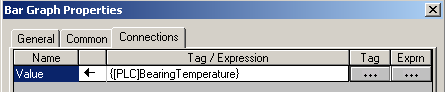
Next, we need to tie the object to a tag in the processor. Go to the “Connections” tab to find your bearing temperature tag. Hit “Apply” and “OK”.
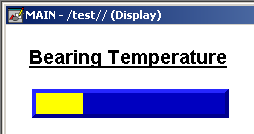
At last the bar graph is set up!
Add a Scale Object
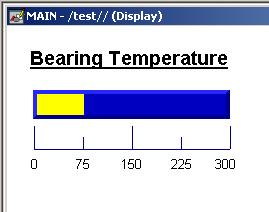
Obviously, the operator does not know the actual temperature by looking at the bar graph. Next, we’ll add a scale to the bar graph. Go to Objects | Bar and Graph | Scale, and draw a scale near your bar graph object.
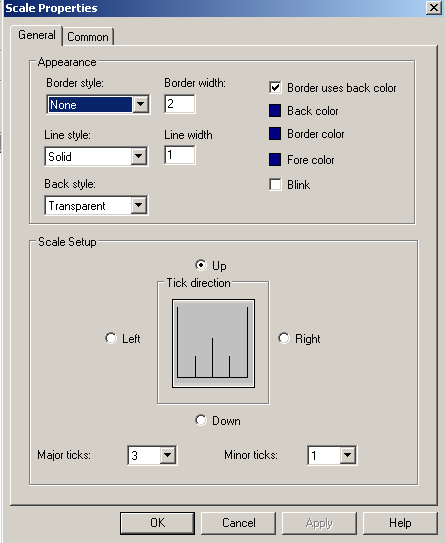
Adjust the orientation, and other properties of the scale.
At last, we’ll draw the text objects to label the ticks on the scale.
Additionally, you could add a numeric input to the bar graph to show the exact value of your bearing temperature.
Test your work
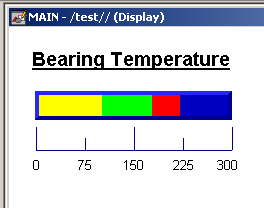
When we test the display, you will see that as our bearing temperature increases, and the thresholds are met, the fill color changes for our bar graph!
— Ricky Bryce
Pingback: FactoryTalk View Gauge Object - Bryce Automation