
Introduction to Adding PlantPAx Objects for PID
In this section, we’ll be Adding PlantPAx Objects for PID. Specifically, we’ll use the P_PIDE instruction. In the last section, we imported objects that we need to get our PID working. Now we’re ready to add those objects to our display.
We created two displays. One for Flow, and the other for Level. We’ll add an Analog Input (AIn) object to each of these displays. Additionally, we’ll add an AOut, PIDE, and a trend chart.
Keep in mind, that we are going to use a simple AOut instruction for our process variable. If your PID controls a valve, for example, the P_ValveC might be more useful.
Since we have not created the logic yet, we’re just going to add the objects we need. Later on, we’ll come back and point these objects to tags in the processor.
Add your Analog Input object
At times, some of the objects are difficult to find. For this reason, I’ll show you the specific objects we will use as an example. Before we begin, open your Flow Display. This will give is a display that we can drop the objects onto.
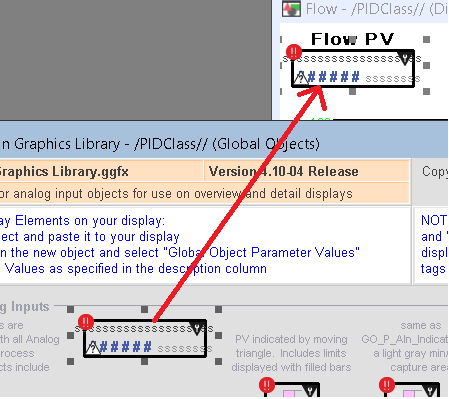
Under Global Objects, go to the P_Ain Graphics Library. Drag the very first object onto your Flow Display. Next, add a text object called “Flow PV” Above the Analog Input object.
Repeat this process for your Level Display. We’ll need one on each screen.
Add Your Analog Output Object
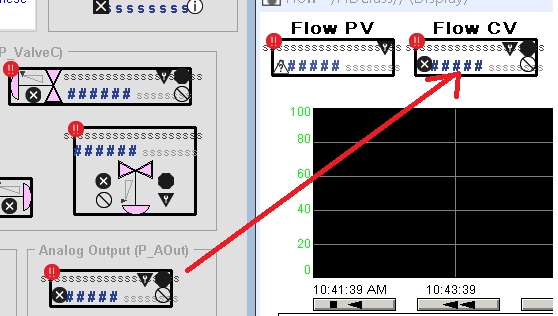
Next, we’ll use an Analog Output. Later on, we’ll set up a cascading PID with the Level display, and we won’t need a CV on that display. For now, just drag an Analog output object onto your flow display. Be sure to label this as Flow CV.
Add your P_PIDE Object (Adding PlantPAx Objects for PID)
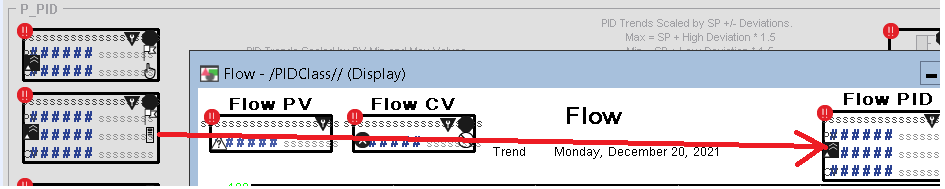
The last PlantPAx object we’ll need is the P_PIDE object. Find RA-BAS P_PIDE Library. This time, we’ll choose the second object in the Library. We will need this object on both the Flow and Level displays. Be sure to add a text object over each PID to identify what process they control.
Add your Trend Chart
Finally, we are ready to add the trend chart. For now we’ll just use live data, so we won’t set up a data log object. Go to Objects | Trending, and add your trend chart. We will also need this on your Level display. When you are finished, your flow display should look something like this:
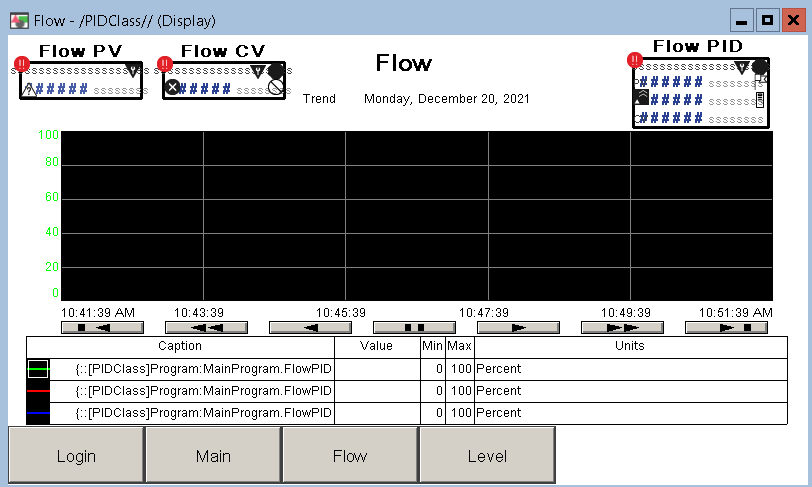
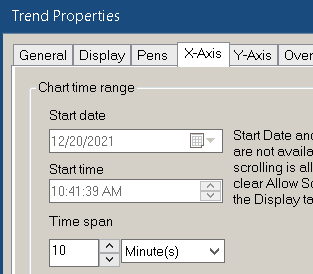
We don’t know what the tags will be yet for the pens on our chart, but we can configure the X and Y Axis at this time. Go to the properties of the trend chart, and set the X axis for a time span of 10 minutes.
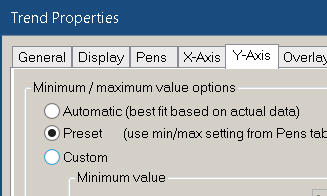
Likewise, go to the Y Axis, and set up your Y axis Scaling as “Preset”. When we add our pens later on, we’ll configure a minimum and maximum value. The chart will use our min and max for each pen as the scale.
Before we finish, go to the Level display. Configure the X and Y Axis in the same way.
It’s important to realize that since we will be using live data, the chart looses it’s data once you close the display. It does save memory and disk space, but we cannot go back on the chart to a previous time. If we were to use a data log model, then FactoryTalk View will store the data even when the display is not running. We would just have to be sure we turn the data log model on in the startup macro.
Summary
To summarize, in the last section, we imported faceplates that we’ll need to use in a PlantPAx PID project. In this section, we simply added the objects we need onto each display. In our next section, we are going to set up our logic in RSLogix / Studio 5000. After that, we’ll come back to these displays and point our objects to the tags in logic.
In the next section, we’ll add the logic for P_PIDE to work.
— Ricky Bryce