Introduction to the Data Log in FactoryTalk View ME.
In this section, we’ll set up a Data Log in FactoryTalk View ME. Whenever you set up a trend chart, usually, you want a data log model to go along with it. When you set up a trend without a data log, your trend data starts all over when you leave the trend display.
Of course, when we attach a datalog to a trend, the datalog model is always logging data in the background. Even when the trend display is not open.
In this case, we are just going to graph a tag called “SpeedReference”. This tag will be in the datalog model. Therefore, FactoryTalk View ME will be logging the data from my SpeedReference tag periodically. We can open the trend at any time to see the current value, and the past history of the values.
Before we begin, just make sure you have a connection to the processor in FactoryTalk Linx Enterprise. To test the data log, we’ll also create a second display called “Trends” (aside from the main display). Be sure to add navigation buttons for the operator to get to and from the trending display.
Create the DataLog Model
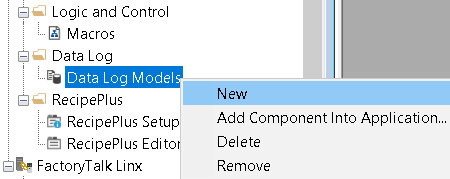
Right-click the Data Log models, and create a new Data Log model.
On the “Setup” tab, be sure to enter the number of data points you wish to keep. In this case, we’ll leave it at default. The “Paths” tab allows you to select a different path to store the data log. Again, we’ll leave this at default.
Under “Log Triggers”, we’ll set this up to log periodically, every one second for example. Your plant application may be different.

Most important is the “Tags In Model”. Be sure to select the tag you wish to log. Remember to refresh folders if necessary when you browse for the tags. Be sure to click “Add”, so your tag appears under “Tags in model”!
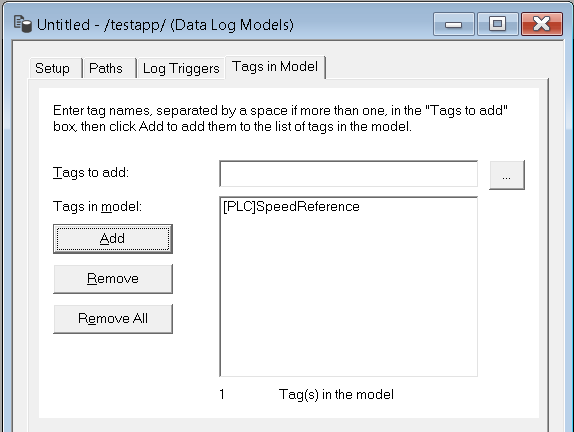
Finally click “Close”. We’ll save this data log model as “MySpeedReference”.
Set the Data Log in FactoryTalk View ME to run at startup.
Now that you’ve created the data log, we must configure it to run at startup. In FactoryTalk View ME, we will only have one data log model running at a time. This is different from FactoryTalk View SE.
Go into “Startup” at the top of the Explorer tree. The icon for startup is the green flag. Be sure to turn on Data Logging at startup. Also, be sure MySpeedReference is selected as your startup data log model..

Create the Trend
At last, we are ready to create the trend, and associate the data log model to the trend chart. On the Trend display, add a trend object. Make this object as large as possible on your display. Trends are under Objects | Trending | Trend.
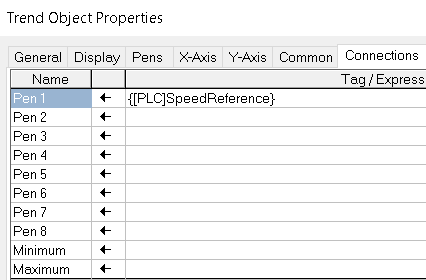
Once you add the object, the property screen appears. First, let’s go to the “Connections” tab and add our SpeedReference tag.
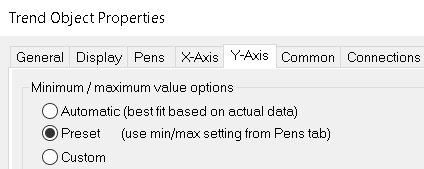
On the Y-Axis tab, I’ll choose “Preset” because I want to enter the minimum and maximum values manually.
We’ll leave the X-Axis tab at default for example. Next, let’s go to “Pens”. Choose a color, and enter the Minimum and Maximum values you expect the pen to be.
Don’t forget to associate your data log model!
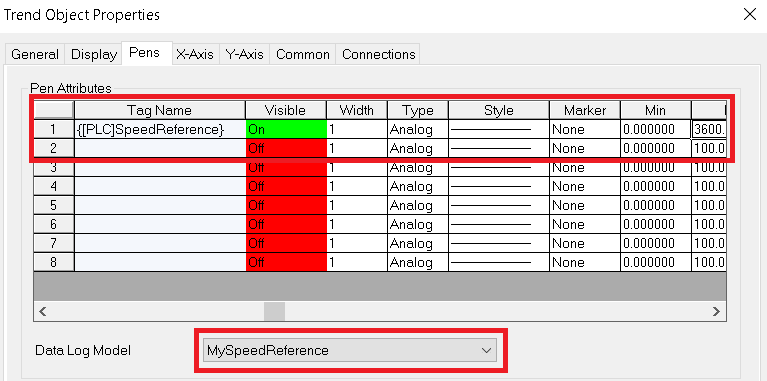
Press “Apply”, and OK.
Test your work
To test your work, you must “Test Application”, because we have a background service to test. We also need to use navigation, so click “Applicaton” then “Test Application”.
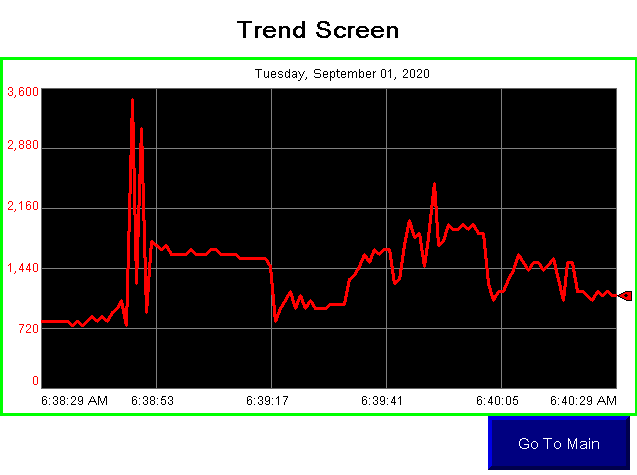
As you can see, we are now tracking data. Test the data log model by navigating to the main screen, and go back to the trending screen.
For more information, visit the FactoryTalk View ME Category Page.
— Ricky Bryce

So I already have a startup macro, how can I run another macro at startup without changing the already in place startup macro?
Leyton,
In FactoryTalk View ME, you might try to run a Log in macro for the default user. By default, when the project starts up, the default user is logged in. This is under “Runtime Security”. Just test it thoroughly to make sure this works for your application. Let me know if it works.
Take care,
Ricky
I guess my other question is how do you connect your trend data log to a macro in Factory Talk View ME? I see how it’s done in the other applications, but in ME the macros look like they can only have tags (if that makes sense). It is not like a script.
Leyton, in FactoryTalk view ME, you can only have one DataLog model running at a time. In SE, you can have more. You turn on the DataLog model at Startup. Just click the green Statup Flag in your explorer tree to turn on the data log. This one DataLog will contain all of the tags you want to log for every trend. After that, you just tie each trend to the data log under the pens tab. The trend chart will only show the tags you have configured for that trend under the connections tab. You are right… in SE, you can basically have a “SCRIPT” (for your macros). But in ME, you can just set tags.
— Ricky Bryce
Alright… so I have another question…
I have a data log now with 15 tags inside of it. I have the 1,000,000 data points possible in the log with a 20 second “grab” interval. So (if I am thinking correctly) you should have:
1,000,000/15=66,666.6667 data points per tag
66,666.6667/3=22,222.2222 minutes of logging which is 15 days (and some change)
For this 15 days of data logging, is that for each tag or is that all together? I have my trend set for 15 days and it seems to not like it.
Leyton,
Are you saving this to a Panelview? If it’s on a panelview terminal, does the media (for your log file path) have enough space left? On modern machines, we don’t expect to run out of space, but that’s very easy to do on a panelview terminal. Also, what doesn’t the trend like? Is it just cutting the data off at a certain point, or are you getting an error? I would think your math is right, but I forget all the details of how the log file works. I’ll have to try this out on a smaller scale to see if I can reproduce the problem you are having.
— Ricky