
Introduction to the Arduino Bar Graph Example
You will usually find the Arduino Bar Graph Example on a default install of the Arduino IDE. Basically, the bar graph shows a graphic indication of an analog level. For instance, you might display a tank level, pressure, or motor speed. In essence, the operator will quickly determine the signal level without taking time to focus his eyes on a numeric value. Particularly, you will find the bar graph example under File | Examples | Display. I’ve created this example using Tinkercad.
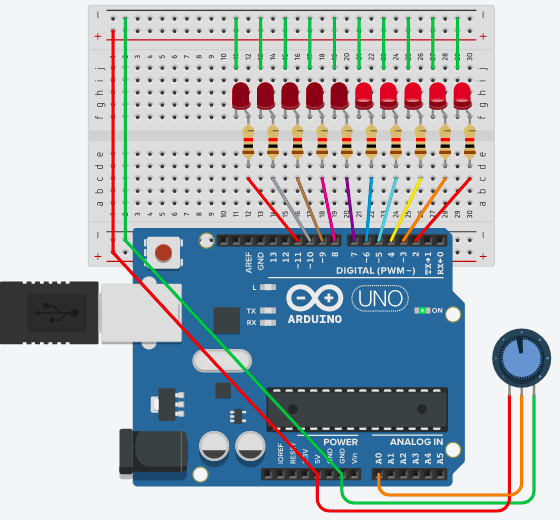
Wiring for the Arduino Bar Graph Example
In this case, we need 10 LEDs. We connect the LEDs to pins 2 through 11. Be sure to add a current limiting resistor in series with the LEDs. Also, be sure the polarity of the LEDs are correct when making your connections, and the cathode of the LED goes back to GND. Obviously, we will also use a potentiometer. Once side of the pot connects to GND, and the other side to 5v. Likewise, the wiper connects to terminal A0. This is the first analog input. For the most part, the connections are very simple.
Code for the Arduino Bar Graph Example
Obviously, at the head of the document, we need to initialize some variables:
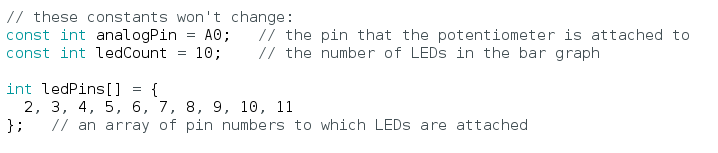
In this situation, the analogPin is where we connect the wiper of the pot. In this case, it will be A0. We also need to indicate how many LEDs we are using. The ledCount is 10.
Next, we have an array of ledPins. Simply put, an array is a group of variables that have the same name with a different index. In this case, the following values are assigned to the variables
| Variable | Value |
| ledPins[0] | 2 |
| ledPins[1] | 3 |
| ledPins[2] | 4 |
| ledPins[3] | 5 |
| ledPins[4] | 6 |
| ledPins[5] | 7 |
| ledPins[6] | 8 |
| ledPins[7] | 9 |
| ledPins[8] | 10 |
| ledPins[9] | 11 |
The void setup() Function
At this point, let’s look at void setup(). Obviously, there is not a lot to do here. We simply set the mode of each pin to OUTPUT.
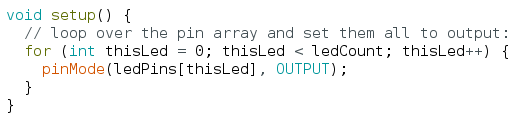
All in all, we execute this loop 10 times. The first time the loop executes, we set ledPins[0] (which is 2) to output. The next time the loop executes the value of “thisLed” increments by 1. (Hence “thisLed++”). Therefore, ledPins[1] (pin #3) goes to output mode, and so on. This process continues as long as thisLed is less than ledCount, which is 10. In summary, all of our digital pins are set to output mode.
The void loop() Function
Until now, we have not actually energized any outputs yet. Basically, void loop() is what will do this work for us. In short, void loop() executes over and over again continuously. At this time, let’s look at it’s code.
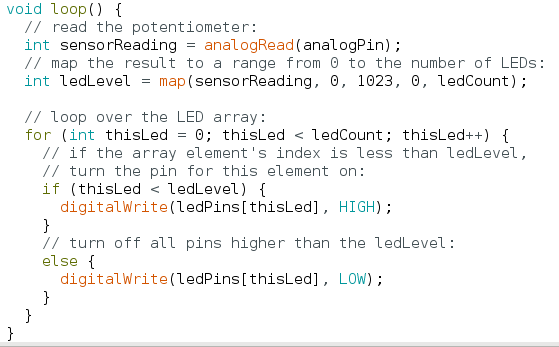
In the first place, we read the analogPin. This raw value will range from 0 to 1023 as we turn the potentiometer.
At this point, we need to figure out the ledLevel to provide to the operator. The map() function is a tool to scale the analog data from our put. Basically, the map function converts the raw value of 0 to 1023 to 0 to 10 (ledCount). For example, if our pot is turned to half of the maximum, the raw value would be around 512. This provides a scaled output value of 5 and stores this value to the ledLevel variable.
At this point, we run a FOR loop in the last half of the void loop() function. This loops executes 10 times. As long as the LED number is less than the ledLevel, the light will turn on. Remember, the scaled value for ledLevel is 5. In summary, void loop() turns on lights 0 to 4 (pins 2-6), which is the first 5 lights.
Once you power up your project, turn the potentiometer. The higher you turn the pot, the more lights will energize.
For more information, visit the category page for beginners!
— Ricky Bryce