
Introduction to ControlLogix Troubleshooting Tips
In this section, we’ll discuss some good ControlLogix Troubleshooting Tips. Downtime is expensive. It’s important to know the tools that you have available to solve your problems quickly. Once you know your tools, you should have no problem troubleshooting your system, and navigating your logic. It’s also important to practice navigating your own plant programs until you are comfortable moving around in logic.
Status Indicators
A valuable tool is the status indicators on your processor and other modules. Whenever a system is completely down, the first thing I check is the processor status lights. Check out this post for more details on the processor status indicators.
Processor Status Indicators
- Run Light — This light should be solid green. If not, then you are probably in program mode, or the processor does not have power.
- OK Light — This light should also be solid green. If the OK light is flashing red, then you have a recoverable fault. Go online with RSLogix / Studio 5000 to get a description of the fault. Once you are online, look at the toolbars. You will see “Faulted” with a red background on the letters. Hit the pull-down menu, and choose “Go to faults” to get a description of the fault. On the other hand, if your OK light is SOLID red (on most any module), then this is a hardware fault. You can try to cycle power, or re-seat the module. You might end up having to replace the module.
- I/O Status — Again this light should be solid green. If it’s flashing green, then you have a problem with at least one module somewhere. The newer processors have an alphanumeric display that will help diagnose the problem. Usually, though, it’s easiest to look at the bottom of your Controller Organizer window. Under the I/O tree, you will see a caution sign on the module that you have a problem with. Simply go to the properties of the module, and click on the connection tab. You will see a description of the error.
I/O Module Indicators
- Output I/O Status Indicators — If an output will not energize, and you don’t know why, go to your schematic. This will show you what chassis, slot, and terminal the output is at. If the status indicator is ON for this output, but the output will not energize, then you might not even need to open Studio 5000. Just get out your meter, and trace down the circuit. Between the output module, and the field device, you could have fuses, relays, and terminal blocks. Just trace down where the circuit failed.
- Input I/O Status Indicators — The input status indicators simply tell us when we have voltage to a terminal with reference to common. Basically these act as “voltage testers”. This tells us when we have power from the power supply, through the field device (switch), all the way back to the input module.
Cross Referencing
For locating outputs in logic, and navigation through the program, Cross Referencing is very useful. Let’s say that a pump will not start. Simply locate that pump on your schematic. This will tell you what chassis, slot, and bit the pump is on. If the status light is OFF on the output card, then find the output in your controller tags. Simply right-click and cross-reference the bit. Remember, you cannot click on the bit first, and then right-click. RSLogix will think you want to cut, copy, or paste. Simply right click the bit and “Go to Cross Reference”.
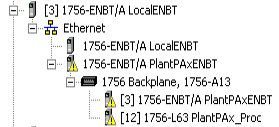
Keep in mind that all tags for modules in the local chassis start with the word “Local”. All tags for modules in a remote chassis start with whatever the programmer named the communication adapter in that chassis.
After you cross reference, look for your “destructive” instructions. These are the instructions that can write to the bit. If there is more than one instruction that is destructive, such as with a latch and unlatch, decide which one you need to go to.
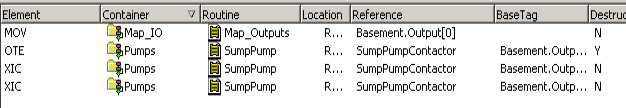
In this example, we will go to the OTE (Output To Energize). It’s destructive, so it has the ability to turn on the bit. We want to see why it’s not doing it’s job.
As you can see, the sump pump did not energize because it’s not getting a request.
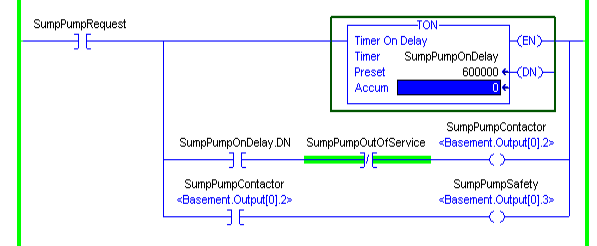
At this point, I would simply right-click “SumpPumpRequest” in logic, and go to it’s destructive instruction. We continue to trace this down until we find out the reason the processor is not calling for the output. When you cross reference within logic, be sure it’s the actual tag that you right click.
Bookmarks (ControlLogix Troubleshooting Tips)
RSLogix / Studio 5000 has a nice book marking feature. It’s just shut off by default. Bookmarks allow us to flag rungs that we know we need to come back to. We just have to turn that feature on. Go to View | Toolbars. At this point, you can turn on your bookmark toolbar. You will see some new icons appear.
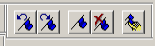
The middle flag inserts or removes a bookmark. when you click this icon, a flag will appear near the rung number that you are on. The first two icons allow you to navigate through your bookmarks. Furthermore, the fourth icon will remove all bookmarks. The last icon allows you to navigate bookmarks individually.
Searching
If you click on Search | Find, you can locate just about anything in your logic from instructions to descriptions. The key to searching though, is that you need to know the nomenclature the programmer was using. For example, if you search for a water pump… Did the programmer call this MWP for Main Water Pump, or did they spell out “Main Water” in the description. Once you start understanding how the programmer set up the logic, searching becomes much easier.
You also have a “Browse Logic” feature under search. This works out if your project is organized well. Basically, this feature just narrows down the scope of your search by choosing what task you want. Then it will ask what program within that task… Finally, you will choose the routine within that program. Once you get to this point, you will see any rung comments in the routine. This should help you figure out what rung you need to be on. Click the + next to a rung, and then double click the instruction. The logic browser will take you straight to this point in your program. This was similar to “Advanced Diagnostics” in the PLC-5 and SLC-500 systems.
Trapping (ControlLogix Troubleshooting Tips)
Occasionally, you will need to know if a bit changed state. For example, your machine quits running intermittently. You suspect an intermittent problem with a safety gate. You can simply write a few rungs of logic to trigger a latch, or to increment a counter. If you put a counter on every guard door, and they start with zero, you should be able to go back and see which guard door has a problem. If any counters incremented right when the equipment shut down, then you might have found your problem.
Add-On Instructions
Some technicians get a bit intimidated with add-on instructions, and complain they can’t see the logic behind them. This is not true. You can see the logic behind any add-on instruction. Simply right-click the instruction and “Open Instruction Logic”. You can even navigate within the add-on instruction itself.
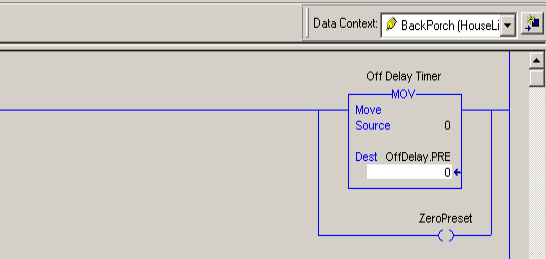
Pay attention to the context, though. The context populates the add-on instruction with data from the context you are on. For example, let’s say you had 10 motors. All of these have the same add-on instruction, but different instruction tags. “MotorA”, “MotorB”, and so on. When you navigate within an add-on instruction, RSLogix / Studio 5000 tends to go back to the definition. This means that your speeds, running bits, etc, are no longer visible for the motor you are troubleshooting. In the top right corner above the instruction logic, you will see the context. Just be sure to refresh this any time you perform a cross reference within the instruction.
Split Screen View — ControlLogix Troubleshooting Tips
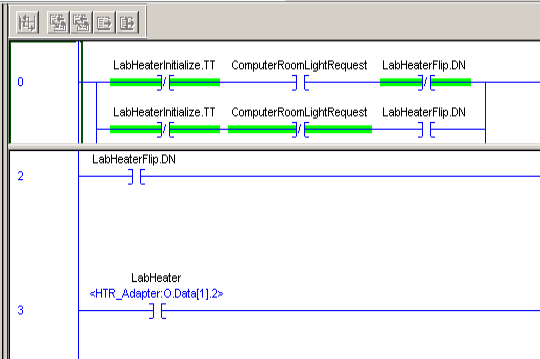
You can look at any routine using two different window panes. This allows you to see rungs simultaneously that would otherwise be too far apart within a routine.
Just above the logic view, you will see a double bar. Move your mouse over this bar, and you will see the icon change. This allows you to drag the bar down for a split view.
Trending
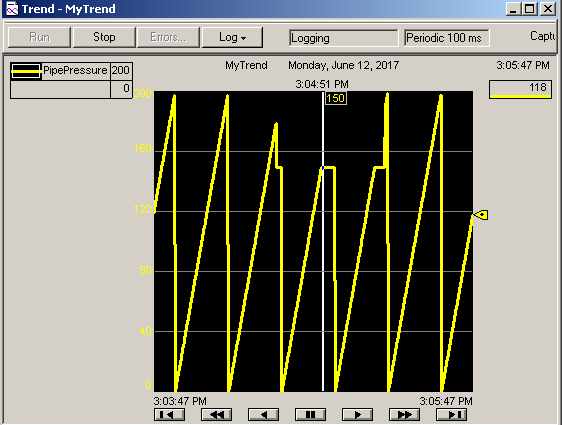
Right above the I/O tree, you have a “Trends” folder. Simply right-click the folder to create a trend, and add the tags you wish to monitor. You can access most all of the trend’s configuration through the properties window. Right-Click the trend chart, and go to properties. You can adjust the X and Y Axis, Add other pens, change colors, etc. Keep in mind this is not a historical trend. The trend only starts at the moment you run the trend. The “Run” button is in the upper left corner of your trend chart. For more details on trending, check out this post.
For more information, visit the ControlLogix Category Page!
— Ricky Bryce